A fibril, measured in time
Can a simple growth model reproduce the pauses seen in an amyloid movie? Compare a published spiral fibril with a matched model, then change one assumption.
Original-movie measurements · exploratory comparisonWhere this experiment fits
Alzheimer’s disease: the larger research study → this supporting growth experiment. We are testing one small part of a future disease model: whether it can reproduce how an amyloid-β fibril grows and pauses. The broader disease context is Alzheimer's; this page does not model the disease as a whole.
Its direct evidence is Watanabe-Nakayama et al. (2016), including Movie S5. Its measurements also support the amyloid component's reference values. For the wider disease and treatment context, return to the disease environment Atlas and choose Alzheimer's.
Current connection: sub-study AFM-S5-01 of Alzheimer’s research study AD-AMYLOID-01. See the larger question, evidence gaps and next steps. It does not predict plaque removal, patient benefit or any medicine's effect. The model still misses parts of the observed growth; this experiment helps us see what needs improving before using it in a larger study.
The source observes fibrils on mica, a flat mineral surface, under liquid. This is a laboratory imaging surface, not attachment to a neuron or a plaque in a patient. The lines beside the movie represent calculated growth only; they do not draw the mica or a molecular attachment.
The environment we can matchLMW Aβ1–42, 2.5 µM · 10 mM phosphate · pH 7.4 · 100 mM NaCl · mica in liquid · room-temperature HS-AFM.
This is a surface-bound experimental environment, not a tissue simulation. Buffer, substrate and peptide concentration provide context; the executable model calculates one fibril fast end. The numerical AFM temperature is unreported.
Movie S5 beside the model
The vertical rulers share the caption’s 395.56 nm field height. The movie field is only 14.98 nm wide. Model lines show added length from an arbitrary zero, not reconstructed fibril geometry or registered end positions.
Published observation
Pixelated strip preserved at its playback aspect ratio. Source MOV 5×132 pixels; MP4 4×132. Width is not a quantitative measurement.
Original movie · Paper, figures & all seven moviesComputed at the same clip-relative time
Movie time drives all model readouts during playback. Nominal frame timing: 70 frames at 10 playback fps, shown 20× faster; frame 69 corresponds to 138 s. Container duration is 7 s (140 s nominal). Clip start is not the NaCl addition time; its absolute incubation offset and growth phase are unknown.
Measured from the original S5 movie
Loading the original-movie measurement record…
This is projected end-to-end growth, digitized from the original 5×132 MOV. The model calculates one fast end: the comparison assumes a stationary slow end. End-to-end length cancels rigid image translation, but not rotation or changes in shape. This is an exploratory discrepancy, not a test of physical equivalence.
Purple: measured, shaded sensitivity bounds · teal: baseline · ochre: candidate · gray dashed: continuous null. All curves subtract their own value at 24 s; model parameters and phase have not been fitted to the movie. Lines connect discrete observations, not additional measurements.
Download frame measurements (CSV) · Method, uncertainty & provenance (JSON)
Inspect every original frame and the traced endpoints
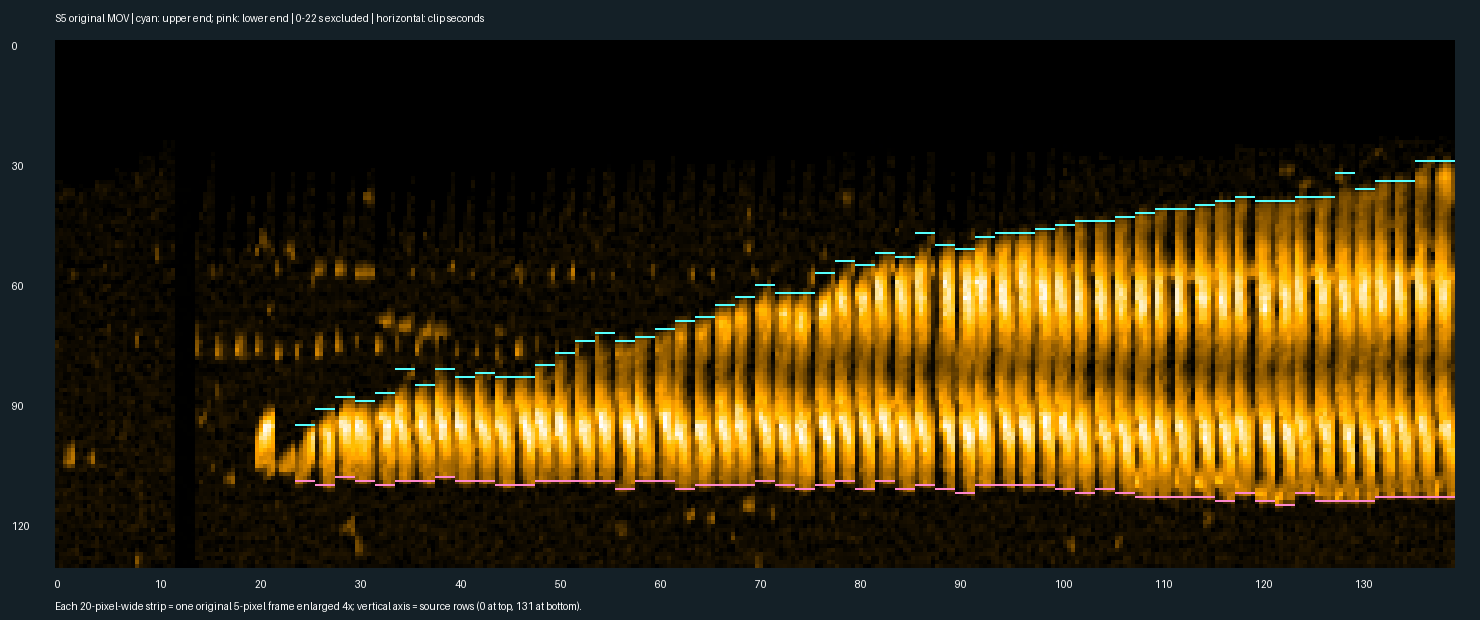
Cyan marks the upper endpoint; pink marks the lower endpoint. Each strip is a whole original frame enlarged with nearest-neighbor pixels. The lower endpoint moves about 12 nm from 24 to 138 s; growth and drift cannot be separated from that motion alone. No manual edits or temporal smoothing were applied to the detected endpoints.
Pause-compatible intervals—not confirmed stops
The detector finds maximal windows of at least 6 s whose nominal projected length spans no more than 2 pixels (6.0 nm), with a common uncertainty interval. They can overlap and must not be counted as separate biological pauses. A true stop and slow growth can both fit these data.
| Observed interval | Observed span | Net change (sensitivity range, nm) | Movie |
|---|
Frame spacing is nominally 2 s. Transitions between sampled frames cannot be timed more precisely; these spans are not estimated full pause durations or confidence intervals. The trace does not establish onset and release times for a biological stop.
Detection sensitivity and uncertainty budget
At each row, take the maximum red-channel intensity across five original pixels. Detect the component crossing row 100, at least 12 pixels long, after closing isolated one-pixel holes. Nominal threshold: 80/255; sensitivity thresholds: 40, 60, 80, 100, 120. The range spans all detected endpoints plus ±1 pixel at each end. Propagate both reference-frame and current-frame bounds when subtracting lengths. This is a sensitivity envelope, not a 95% confidence interval.
Scale: 395.56/132 = 2.997 nm per raster row; timing: 20× speedup at 10 playback fps gives 2 s per frame. Source scale and timing calibration errors are unquantified. Tip convolution, display contrast, endpoint definition and rotation are additional systematic uncertainties. Frames 0–22 s are excluded because attachment/identity is ambiguous; no missing value is replaced by zero. Automated digitization and whole-strip visual review have not received independent human validation.
Change the pause, keep the comparison matched
“Dwell” means the pause between growth steps. Baseline repeats a 29 s pause followed by 62 nm growth over 42 s. The continuous null grows at the same cycle-average speed (62/71 nm/s), but has no pauses. The candidate is a what-if comparison: only its pauses change, from the time you choose. This is an assumption you set, not a predicted drug effect.
When to change this: only to ask what happens if growth pauses become longer or shorter. Leave it at 1 for the unchanged comparison. 0.5 means a 14.5 s full pause; 1 means 29 s; 2 means 58 s. The initial value of 2 is an illustrative scenario, not a recommended setting or drug dose. Nothing here establishes which value a treatment would cause.
Applying settings starts a fresh comparison. If a pause has already started, only its remaining portion slows or speeds up at the selected time. A growth step already in progress continues unchanged. Growth speed stays fixed. Reset and rerun are deterministic.
Where the model agrees—and where it does not
| Evidence | Model comparison | Standing |
|---|---|---|
| Table 1: spiral dwell 29 s; step time 42 s; step size 62 nm. Exponential-fit parameters, 38 fibrils / 124 steps. | Baseline uses these exact inputs. Candidate’s fully exposed dwell is s; change from published fit s. | Calibration agreement by construction; the candidate difference is an imposed assumption. |
| Figure 2: intermittent fast-end elongation. | Stop/go baseline has pauses; the constant-speed null cannot reproduce them. | Qualitative agreement with the paper; original S5 digitization above now provides descriptive length residuals. Complete stops remain unresolved. |
| Figure 3: distributions of dwell, step time and step size. | Our repeated fixed cycles have no variation. | Known mismatch: the model does not reproduce population variability. |
| Movie S5: spiral morphology and movement within the field. | Only added length is calculated. Twist, height, lateral interactions, fragmentation and end polarity are absent. | Not reproduced. No pixel-to-height conversion or molecular mechanism inferred. |
| Original S5 projected length, 58 accepted frames. | Measured above with endpoint sensitivity bounds; compared at the same frame times without fitting the model. | Within-paper exploratory comparison. Raw AFM maps, independently reviewed annotations and held-out fibrils are still needed for validation. Exact pause-event errors are not scored. |
A matched field and clock make comparisons interpretable; they do not establish that our environment is physically equivalent. Table 1 describes a population, not the exact S5 trajectory. Its fitted parameters have no reported confidence intervals here.
Sources, assumptions and reproducibility
Table 1 and Figure 3 · PDF page 4 · Methods · PDF page 6 · Publisher Movie S5
Watanabe-Nakayama et al., PNAS (2016). PMC4889376 · PMID 27162352 · DOI 10.1073/pnas.1524807113. Table values are source-checked transcriptions; the original-movie projected-length trace is a new exploratory digitization. This experiment uses the LMW spiral group only; the inconsistent HMW Table S1 rows are excluded.
Export includes the parent study and child experiment identifiers, source identifiers and PDF hash, conditions, active settings, intervention timing, matched control, current checkpoint, separately labeled end-of-run output, 70 model checkpoints, all original-movie measurements and their uncertainty, and the current and whole-window model residuals. Missing measurements remain missing.